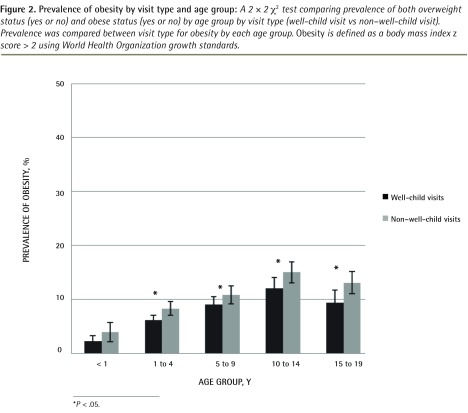
Figure 2.
Prevalence of obesity by visit type and age group:
A 2 × 2
 2
test comparing prevalence of both overweight status (yes or no) and obese status (yes or no) by age group by visit type (well-child visit vs non–well-child visit). Prevalence was compared between visit type for obesity by each age group. Obesity is defined as a body mass index z score > 2 using World Health Organization growth standards.
*P < .05.

