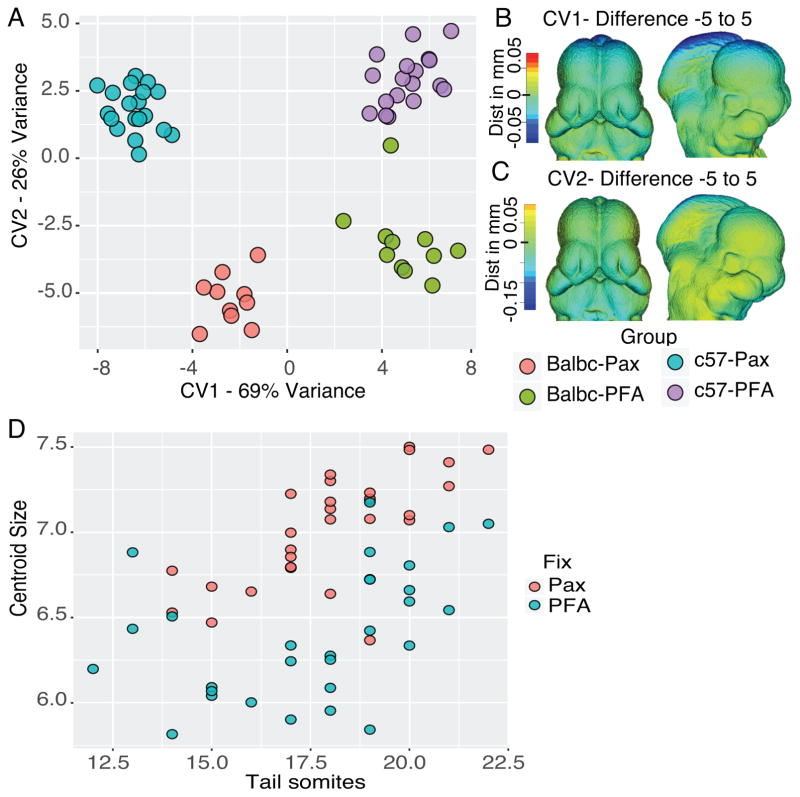
Figure 1.
Different fixation methods effect size. A) Canonical Variates Analysis of the two mouse strains by two fixation methods. The first Canonical Variate separates group by fixation and the second by strain. B–C) Heat maps showing the changes across CV1 (B) and CV2 (C). Changes are the difference between the −5 end of the CV and the +5 end of the CV. Note that there are large negative changes in the top of the head in CV1 as CV value moves toward the PFA fixation. D) Plot of tail somite number versus centroid size.

