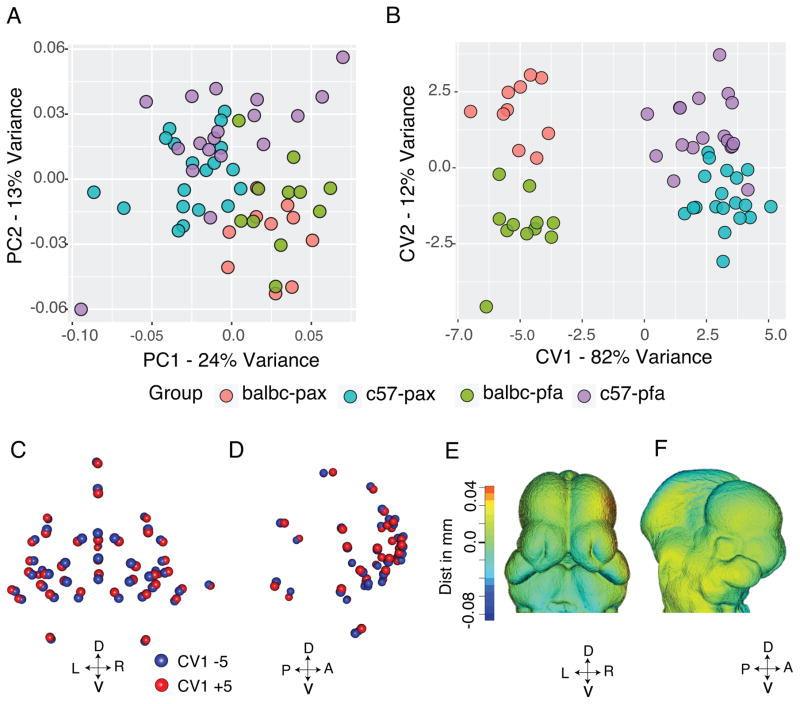
Figure 2.
Shape differences between groups following size regression. A) Principal Components Analysis showing the overall variation of all data. B) Canonical Variates Analysis with grouping by the two mouse strains and the two fixation methods. The first Canonical Variate separates group by strain. C–D) Displacement maps showing the difference at each landmark position between CV1 −5 (blue) and CV +5 (Red). Dorsal (D) is up, Ventral (V) is down. C) Frontal view (L -left, R - right) and D) lateral view (A - anterior, P - posterior). E–F) Color map of the same changes.

