Figure 1.

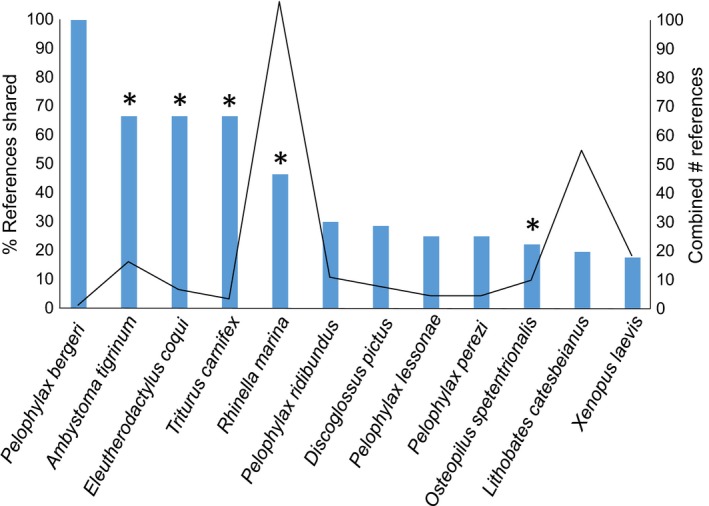
The percentage of references shared (blue bars) and the combined number of references (solid line) used by the two studies per species. Species marked with * were classified the same in both studies

The percentage of references shared (blue bars) and the combined number of references (solid line) used by the two studies per species. Species marked with * were classified the same in both studies