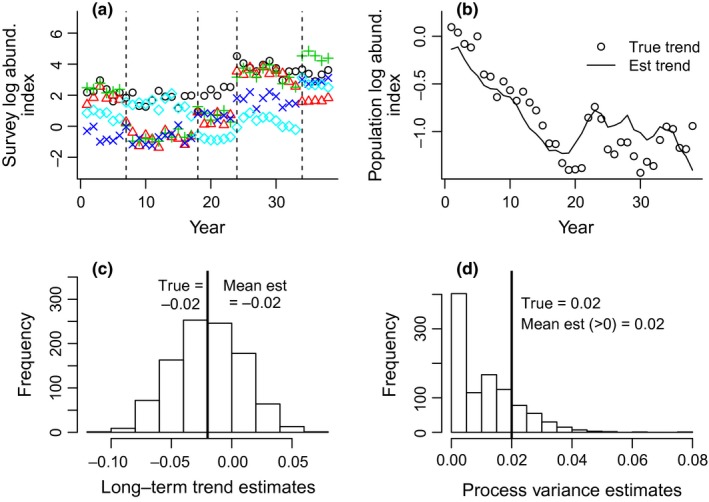
Figure 2.

Results of the simulation study of estimation of the population growth and process error for data structured similar to the Recreational Fishery (Rec) survey in the North Puget Sound (NPS). The data are divided into segments of 6, 11, 6, 10, and 5 years long. There are three spatial replicates [marine catch areas (MCAs)]. In this simulation, there is one population trajectory representing the rockfish assemblage surveyed by the Rec survey in NPS. The true population is declining 2.0% per year on average in the simulation; process variance was set to 0.02. For this simulation, the scaling factors were chosen to increase with each successive segment, creating the illusion of an increasing trend. One thousand datasets and population trajectories were generated; long‐term population growth rate and process variance were estimated for each. (a) Example of the true population trajectory and estimated population trajectory for one dataset. (b) Histogram of the 1000 long‐term population growth rate estimates showing that they are unbiased (i.e., non‐zero). (c) Histogram of the process variance estimates. A feature of state‐space models is that there can be a likelihood maximum with one of the variances at zero (degenerate model). The interior (non‐zero) variance estimates are unbiased. In practice, if a degenerate estimate occurs, one examines the likelihood surface to find the interior local maximum where all variances are non‐zero
