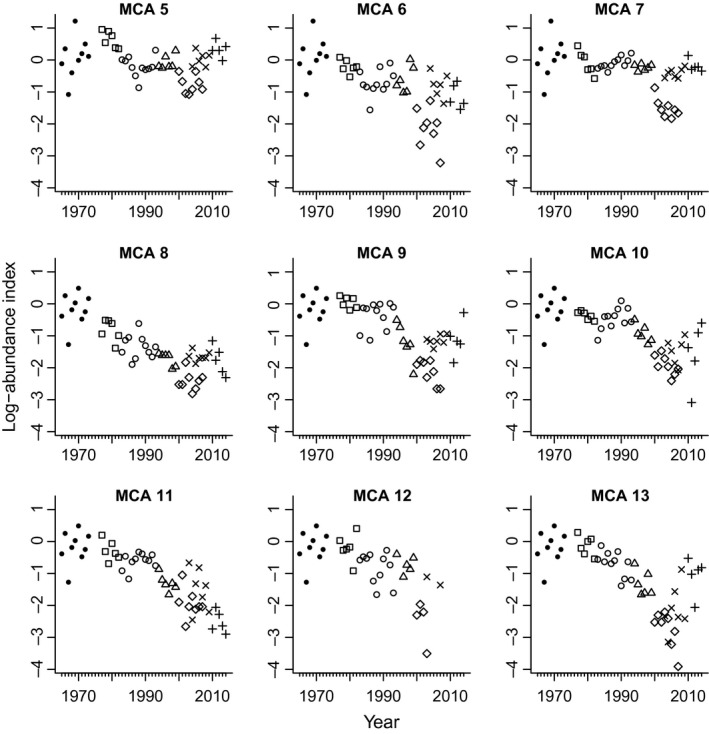
Figure 4.

Log‐abundance index from the Washington Department of Fish and Wildlife (WDFW) recreational survey. The data are the log of catch (retained and released) per angler effort (catch‐per‐unit effort, (CPUE), where effort is defined as one angler trip. The different symbols represent periods with different bag limits. Note that the + and × are data obtained using a new methodology that includes a phone survey in addition to a creel (dockside) survey. The new methodology yields CPUE values that are higher than the prior method (see overlapping years with open diamonds and ×)
