
Figure 7.
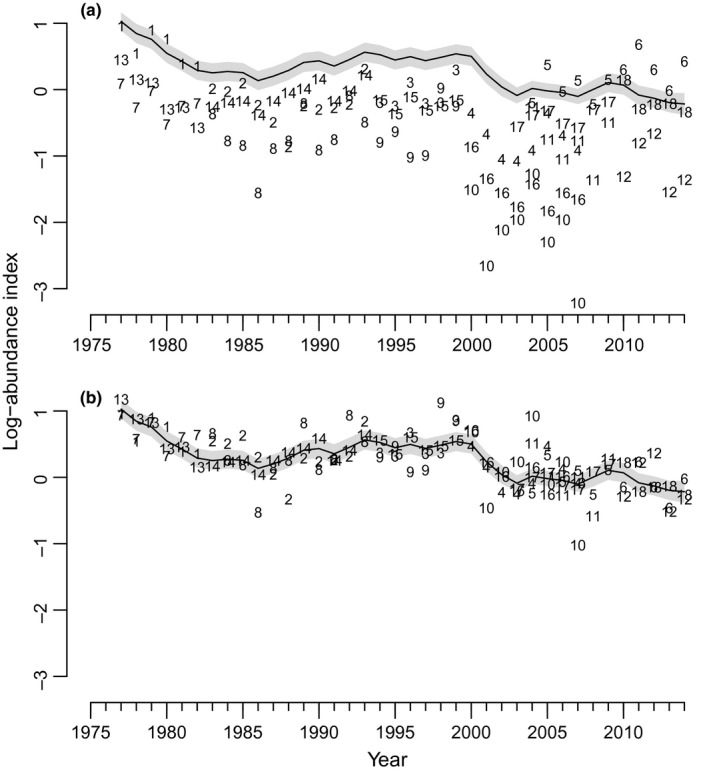
Estimated trajectory (solid line) for total rockfish in North Puget Sound [NPS (RecNPS)] from the best‐supported model using the Rec data only showing the effect of the scaling parameter a. Numbers refer to separate Rec time‐series for each regulatory period in marine catch areas (MCAs) 5–7. (a) Raw data for each NPS time‐series, and (b) data for each NPS time‐series corrected by the scaling parameter a. Grey envelopes indicate 95% confidence intervals