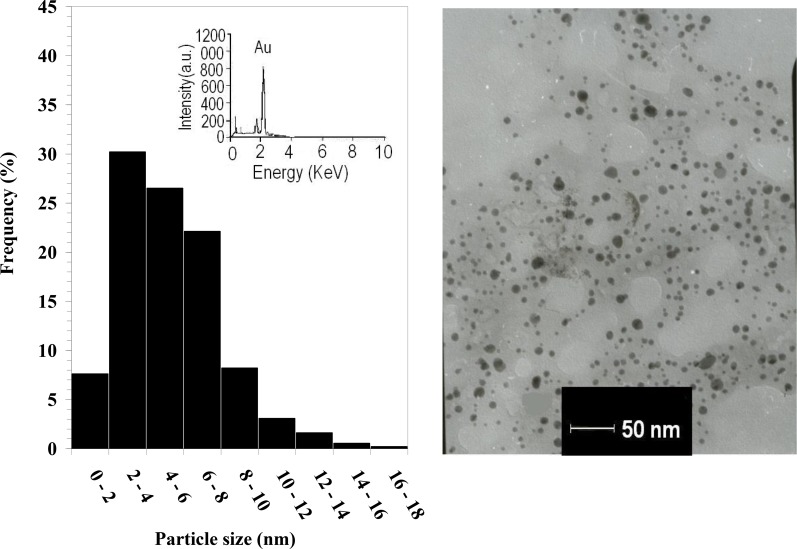
Fig. 2:
Transmission electron micrograph recorded from a small region of a drop-coated film of chloroauric acid solution treated with the free tannin ethanol extract of black tea (right-hand picture) for 15 min (scale bars correspond to 50 nm). The related particle size distribution histogram (left-hand picture) was obtained after 350 individual particles were counted for each sample. The inset in the left-hand illustration shows the energy-dispersive spectroscopy spectrum of the prepared gold nanoparticles. The gold X-ray emission peak is labeled. Strong signals from the atoms in the nanoparticles are observed in the spectrum and confirm the reduction of gold ions to gold nanoparticles.

