
Table 1. Comparison of the proportions of abnormal fertilization between MI-arrested oocytes and MII oocytes.
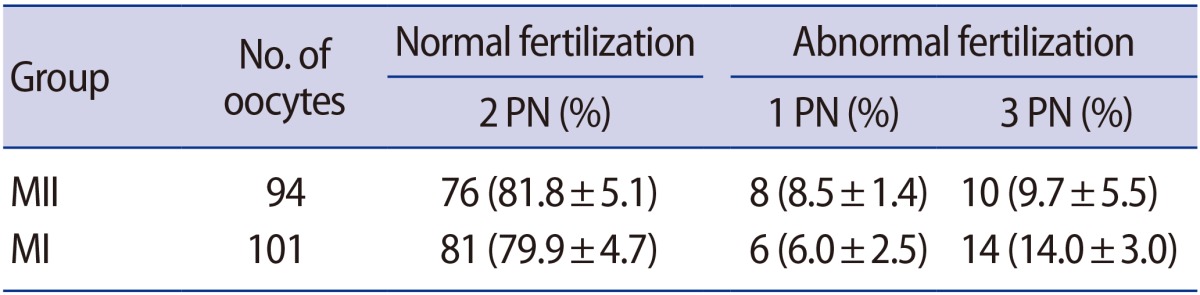
Values are presented as number (mean±standard deviation).
MI, metaphase I; MII, metaphase II; PN, pronucleus.
Official websites use .gov
A
.gov website belongs to an official
government organization in the United States.
Secure .gov websites use HTTPS
A lock (
) or https:// means you've safely
connected to the .gov website. Share sensitive
information only on official, secure websites.
Values are presented as number (mean±standard deviation).
MI, metaphase I; MII, metaphase II; PN, pronucleus.