
FIGURE 1.
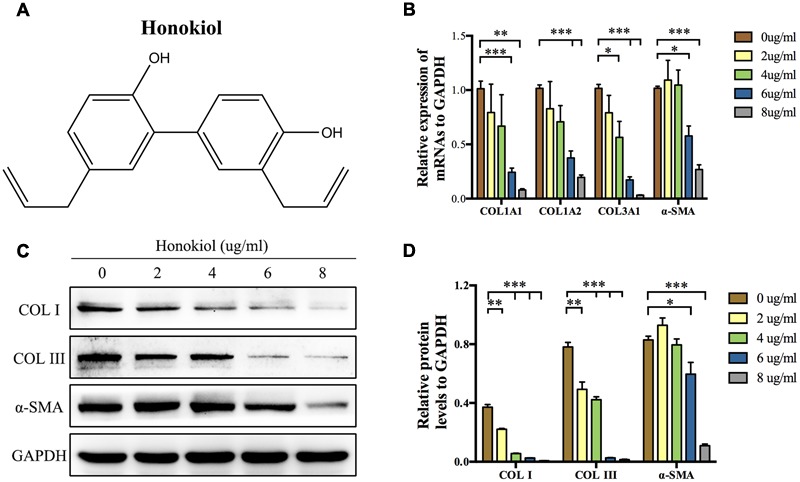
Effects of HKL on mRNA and protein levels of fibrosis-related molecules. (A) Chemical structure of HKL. (B) qRT-PCR results of the mRNA levels of COL1A1, COL1A2, COL3A1, and α-SMA after HKL treatment for 2 days at 0, 2, 4, 6, or 8 μg/ml. GAPDH served as control. n = 3. (C) Western blot results of protein levels of COL I, COL III, and α-SMA after HKL treatment for 3 days at 0, 2, 4, 6, or 8 μg/ml. GAPDH was used as loading control. (D) Quantification of protein levels in (C) which normalized to the level of GAPDH. n = 3. Each bar shows as mean ± SD. ∗P < 0.05; ∗∗P < 0.01; ∗∗∗P < 0.001.