
FIGURE 5.
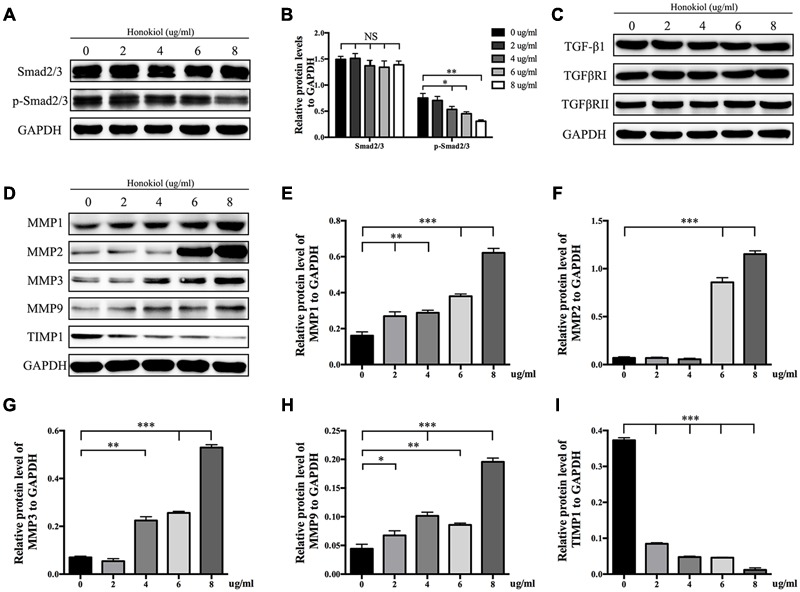
HKL inhibited phosphorylation of Smad2/3 and affected protein levels of MMPs and TIMP1. (A) Protein levels of total Smad2/3 and p-Smad2/3 of HSFs after HKL treatment at 0, 2, 4, 6, or 8 μg/ml for 3 days. GAPDH served as control. (B) Quantification of protein levels of total Smad2/3 and p-Smad2/3 which normalized to the level of GAPDH. n = 3. (C) Results of western blot showing levels of TGF-β1, TGFβRI, and TGFβRII with different HKL treatments. GAPDH served as control. (D) Western blot results showing the protein level changes of MMP1, MMP2, MMP3, MMP9, and TIMP1 after HKL treatments in HSFs. GAPDH served as control. (E) Quantification of protein level of MMP1 showed in (D). n = 3. (F) Quantification of protein level of MMP2 showed in (D). n = 3. (G) Quantification of protein level of MMP3 showed in (D). n = 3. (H) Quantification of protein level of MMP9 showed in (D). n = 3. (I) Quantification of protein level of TIMP1 showed in (D). n = 3. Each bar shows as mean ± SD. ∗P < 0.05; ∗∗P < 0.01; ∗∗∗P < 0.001.