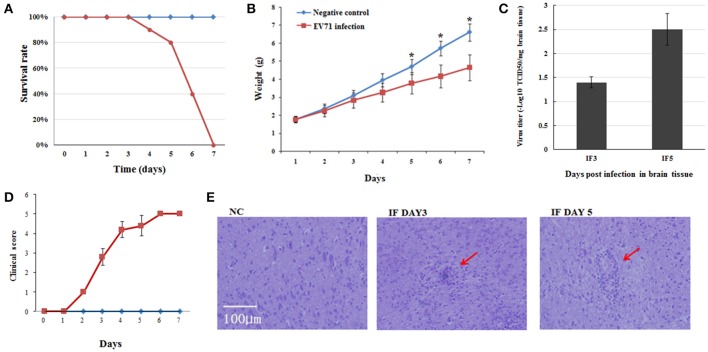
Figure 1.
Pathogenesis of EV71 infection in mice. (A) Survival rates of EV71 infected mice vs. negative control mice. (B) Weight gain in EV71 infected mice. Mice were monitored for 7 days. Data are presented as mean ± standard deviation (SD), n = 3, *P < 0.05. (C) Virus titer in EV71 infected mice brain, n = 3. (D) Clinical symptoms of EV71 infected mice, n = 10, data are presented as mean ± SD. (E) HE staining of mouse brain sections. NC, IF DAY3, and IF DAY5 represent uninfected negative control, and EV71 infected at 3 dpi and 5 dpi, respectively. The red arrows indicate monocyte infiltration.

