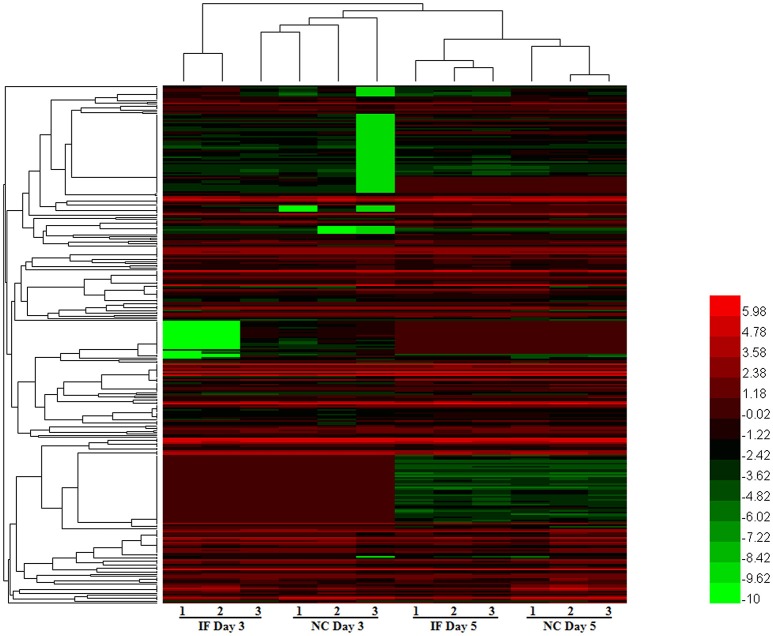
Figure 2.
The miRNA expression patterns in EV71 infected mice brains. A total of 328 miRNAs were detected in EV71 infected mouse brain at 3 and 5 days post-infection. Their expression profiles are depicted using a clustered heatmap. The rows and columns correspond to different miRNAs and mice respectively. The different colors indicate different expression levels, red indicates up-regulation and green indicates down-regulation.

