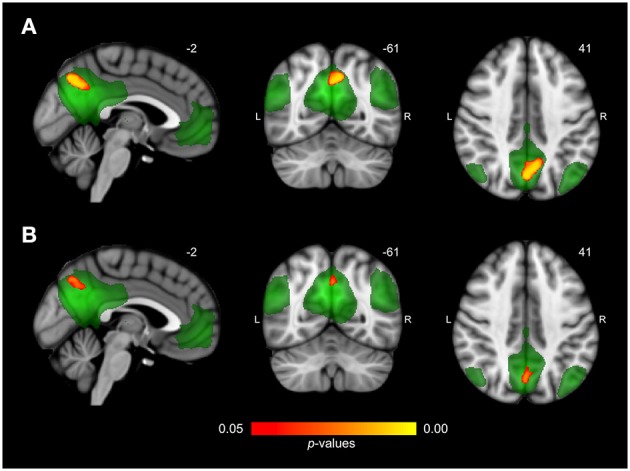
Figure 2.

Differences in network connectivity between AD patients and elderly controls. (A) Reduced functional connectivity in AD patients compared to elderly controls between the default mode network (shown in green) and the precuneus (shown in red-yellow at p < 0.05, corrected). (B) Reduced functional connectivity in AD patients compared to elderly controls when including regional gray matter volume as regressor.
