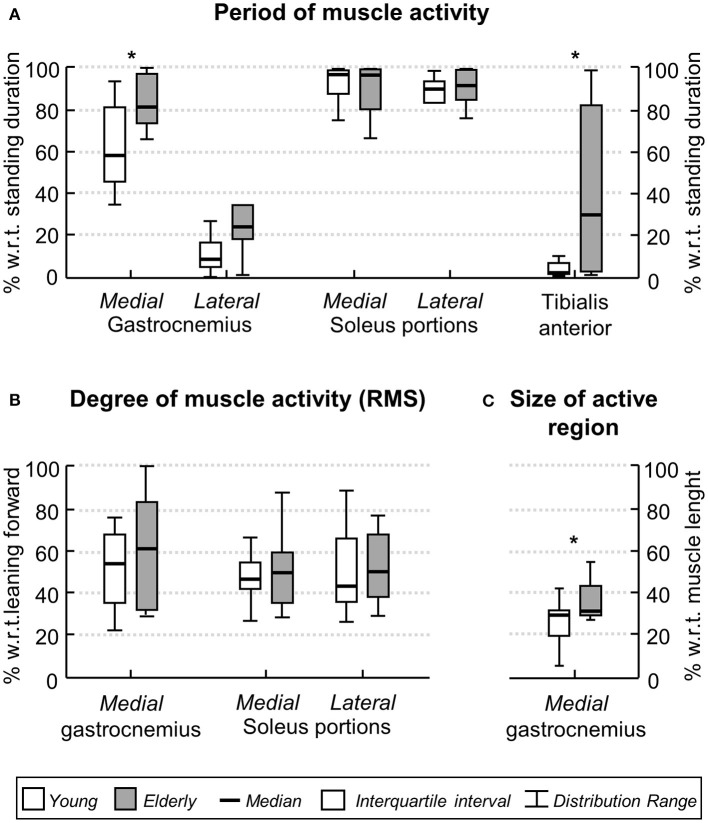
Figure 5.
Age-related differences in the ankle muscles' activity during standing. Boxplots in (A) show the relative period within which, during standing, young (white boxes) and elderly (gray boxes) individuals activated their ankle muscles. Group data in (B) corresponds to the normalized, RMS amplitude obtained for both groups from the medial gastrocnemius and from the medial and lateral soleus portions. The proximo-distal size of medial gastrocnemius region over which largest EMGs were detected in both groups is shown in (C). Asterisks indicate significant differences between groups (P < 0.05).

