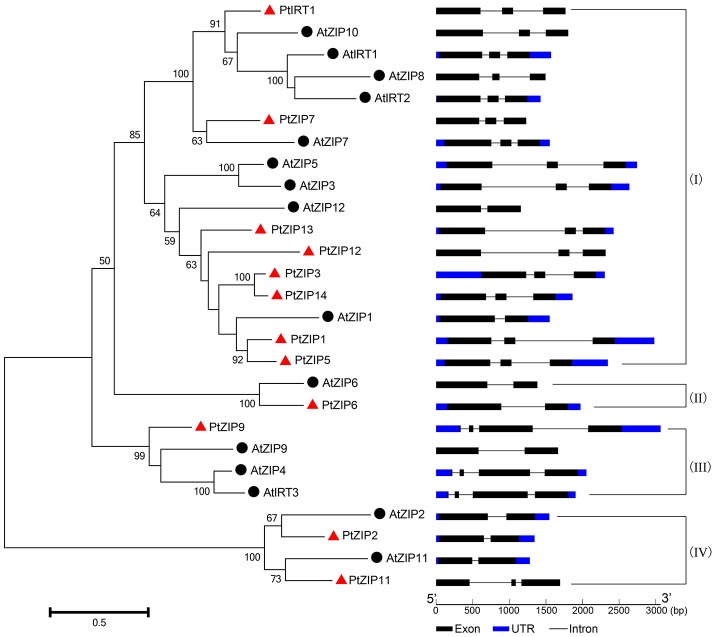
Figure 2.
Phylogenetic tree and gene structure of PtZIP and AtZIP proteins. Twelve of the PtZIP proteins (marked with red triangles) and 15 of the AtZIP proteins (marked with black spots) were used to construct the neighbor-joining tree. Bootstrap values above 50 and supporting a node used to define a cluster are indicated. The structures of each gene were analyzed online using the Gene Structure Display Server and displayed according to the order of the phylogenetic relationship. The black boxes, blue boxes and lines represent exons, UTRs and introns, respectively, and their lengths are shown proportionally. The proteins were divided into four groups (I to IV) according to their phylogenetic relationships.

