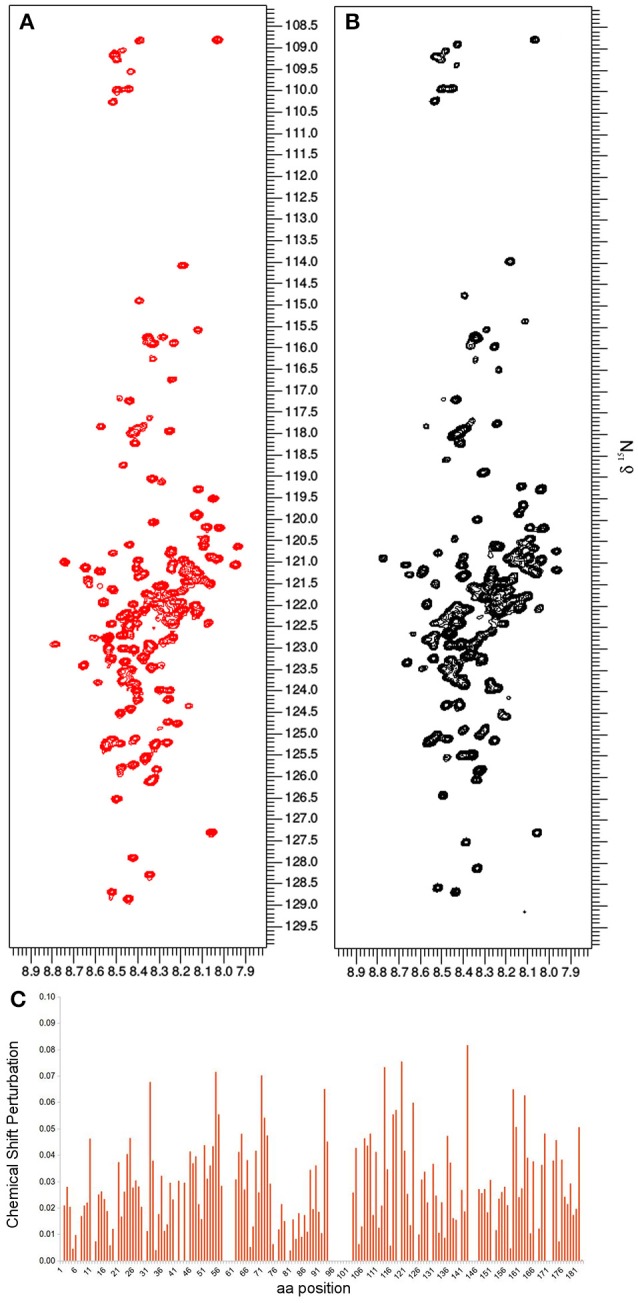
Figure 2.

The in vitro NMR analysis for ERD14 comprised the collection of 1H-15N-HSQC spectra and monitoring the chemical shift perturbation (CSP). 1H-15N-HSQC spectra were obtained with 25 μM of 15N-labeled ERD14 in 50mM MES buffer at pH = 6.5 (A) and under molecular crowding conditions that were generated with a cell lysate of BY-2 cells (B). The CSP for ERD14 is represented in C and reveals changes in the chemical shifts of the protein due the modification of its environment. These CSP data can typically be used to determine the location of binding sites, the affinity of interactions or to monitor conformational changes of the complex.
