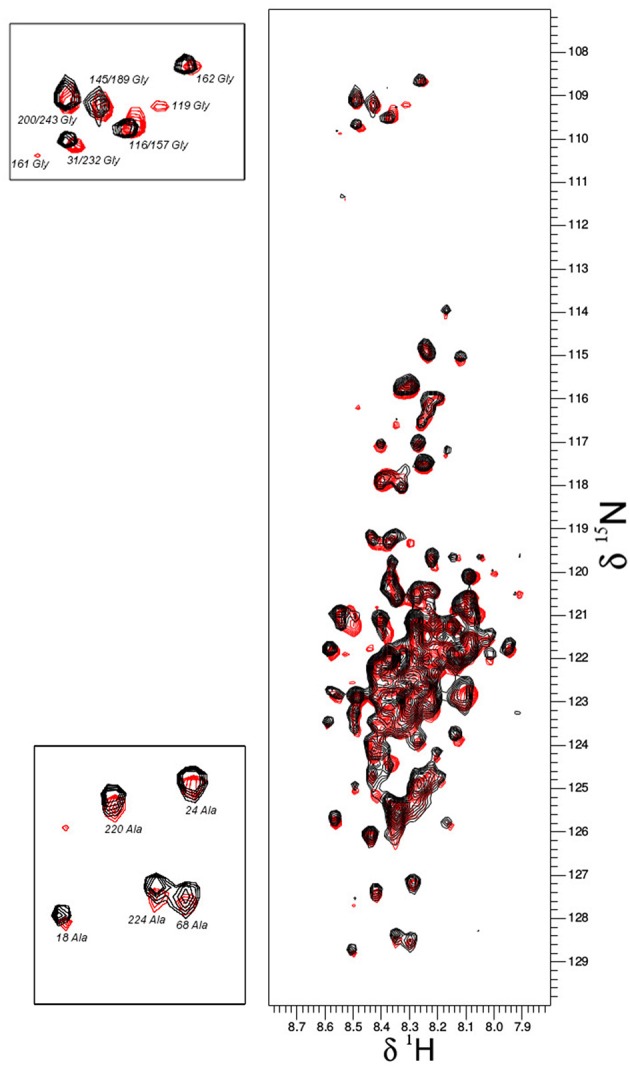
Figure 3.

Overlay plot of the NMR 1H-15N-HSQC spectra of 15N-labeled ERD10 that were collected under two different in vitro conditions. The 1H-15N-HSQC spectrum of 25 μM ERD10 in 50 mM MES buffer pH = 7.3 (red) is superimposed with the 1H-15N-HSQC spectrum of 25 μM ERD10 that was measured in a BY-2 cell extract (black). The upper-left panel shows the area in the HSQC spectrum were most glycines are overlapped, while the lower-left panel shows well separated alanines in greater detail. No significant chemical shift perturbation is observed when comparing the two datasets.
