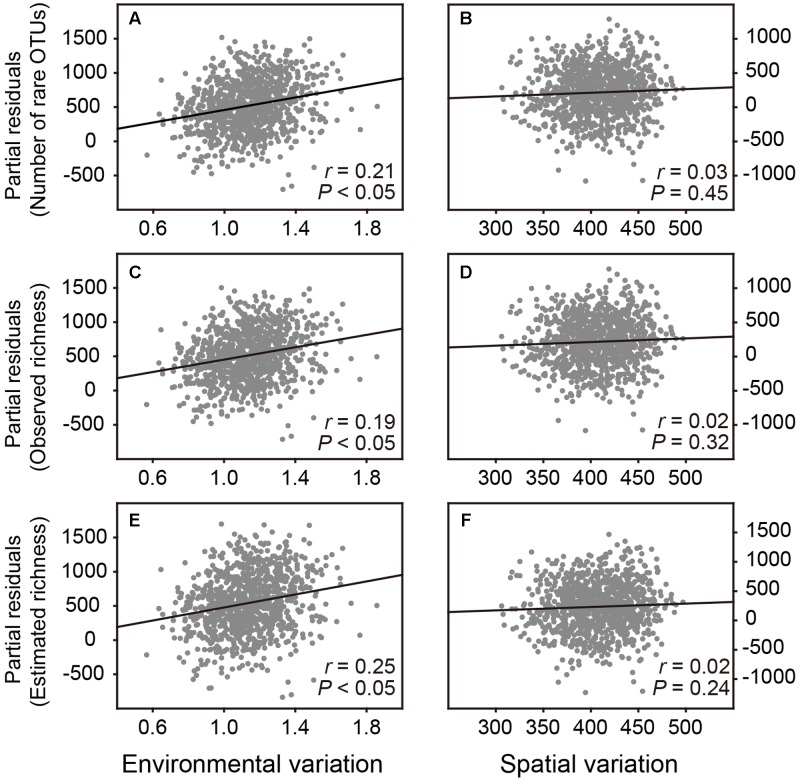
FIGURE 3.
Partial residuals plots show the independent effects of environmental and spatial variation on estimating the bacterial OTU richness. These plots show the effect of a given independent variable when all others in the models are controlled for. (A,B) The effects of environmental and spatial variation on number of rare OTUs. (C,D) The effects of environmental and spatial variation on observed OTU richness. (E,F) The effects of environmental and spatial variation on estimated OTU richness.

