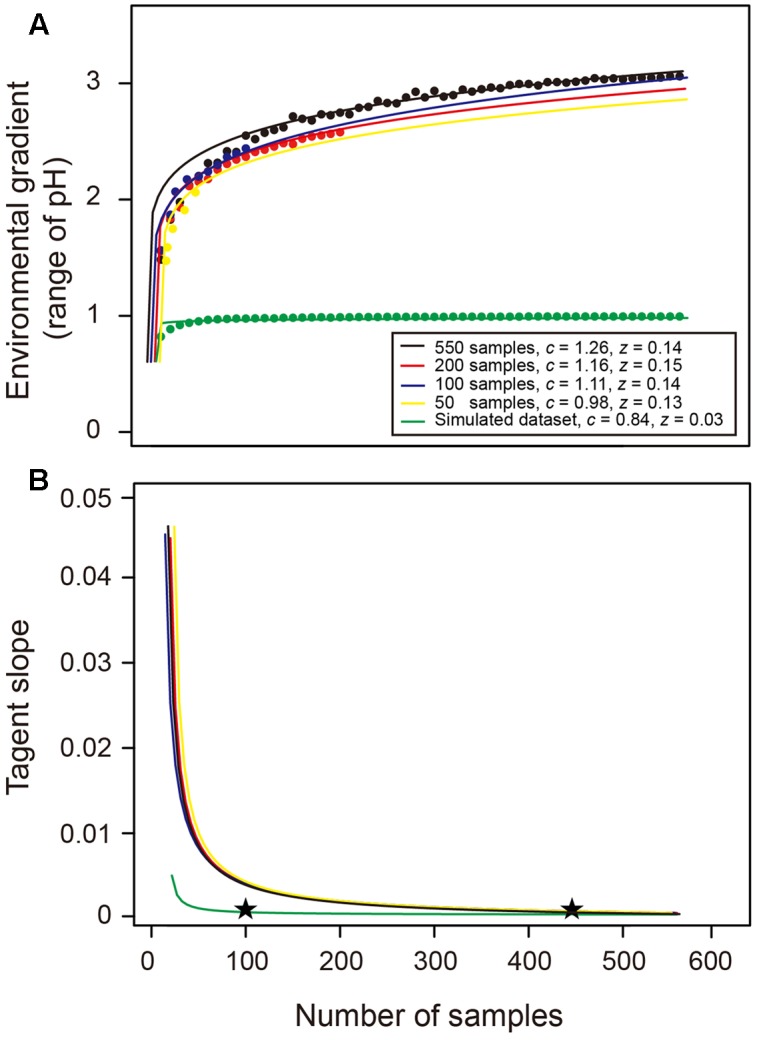
FIGURE 5.

Environmental heterogeneity equation (EHE) and the change of its tangent slope across sample sizes. (A) Theses data were fitted by a power law function and these EHE describe the relationship between number of samples and captured environmental gradient (i.e., range of soil pH in this study). Black, red, blue, and yellow lines denote the EHE when the total dataset is 550, 200, 100, and 50 samples, respectively. Green line describes the EHE of our simulated homogenous dataset with narrower pH range. The c and z values denote the coefficients of power law EHE (E = cSz). (B) The tangent slopes across sample sizes represent the derivative of EHE. Stars indicated the approximate sample sizes when the slope was closed to 0.
