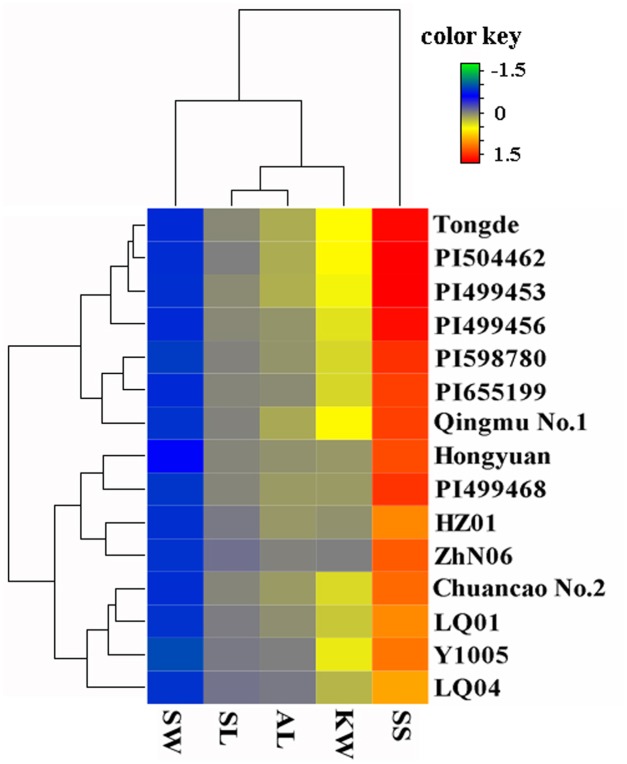
FIGURE 2.
Clustering and Heatmap analysis of the 15 E. sibiricus accessions using morphological traits. Accessions name are shown in right side of the heatmap. The color scale of heatmap ranged from –1.5 to 1.5 (green to red). Each line and column represents different accessions and different traits, respectively.

