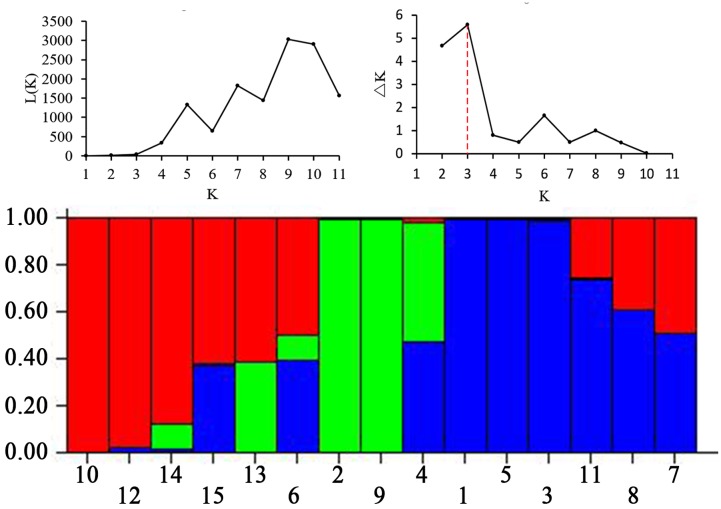
FIGURE 3.
Three groups of 15 E. sibiricus accessions inferred from STRUCTURE analysis and the description of detected the optimum value of K by using graphical method. Three types of color represent different groups. Accessions designations refer to Table 1.

