Figure 3.
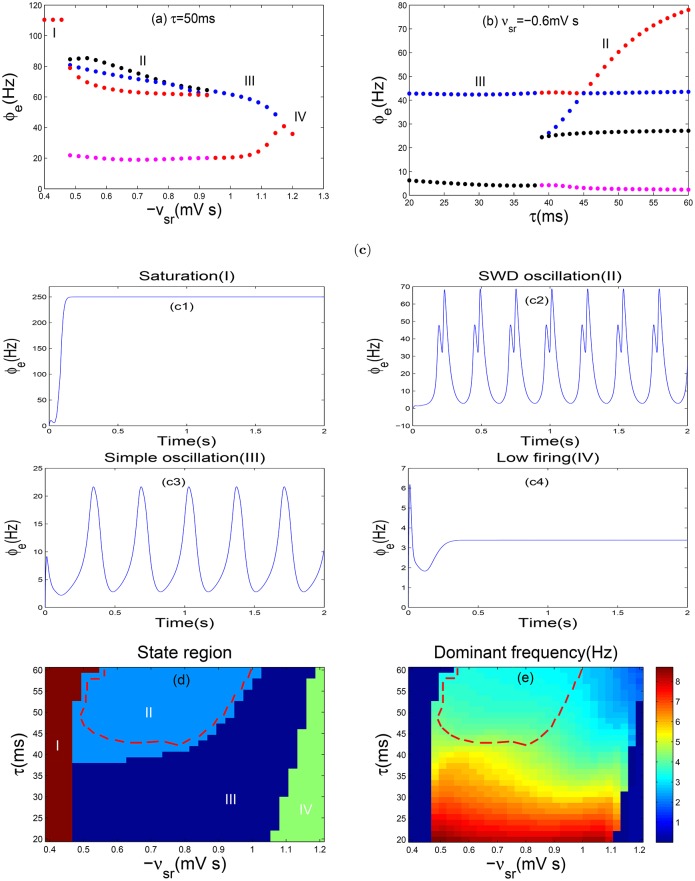
Absence seizures induced by coupling strength of TRN-SRN pathway and the slow dynamics of GABAB receptorS in TRN. (a,b) The bifurcation diagrams in ϕe, are obtained by varying −vsr (a) and τ (b). Here −vsr represents the inhibitory coupling strength of TRN-SRN pathway, whereas τ denotes the GABAB delay. In order to observe the bifurcation phenomenon obviously, the ordinate scale is used exactly in a log scale in (a). Four types of dynamics state regions, including the saturation region (I), the SWD oscillation region (II), the simple oscillation region (III), the low firing region (IV) are indicated. (c) The typical time series of ϕe are corresponding to the above four different dynamics states. Here we choose −vsr = −0.4 mV s (c1), −vsr = −0.6 mV s (c2), −vsr = −1.1 mV s (c3), −vsr = −1.2 mV s (c4) and set τ = 50 ms. (d,e) Two-dimension bifurcation diagram (d) and dominant frequency diagram (e) in the (−vsr, τ) panel. Different colors in (d) represent the different dynamical states. The region surrounded by red dashed lines in (d) represents the SWD oscillation regions, which falls into the 2–4 Hz frequency range in (e).

