Figure 4.
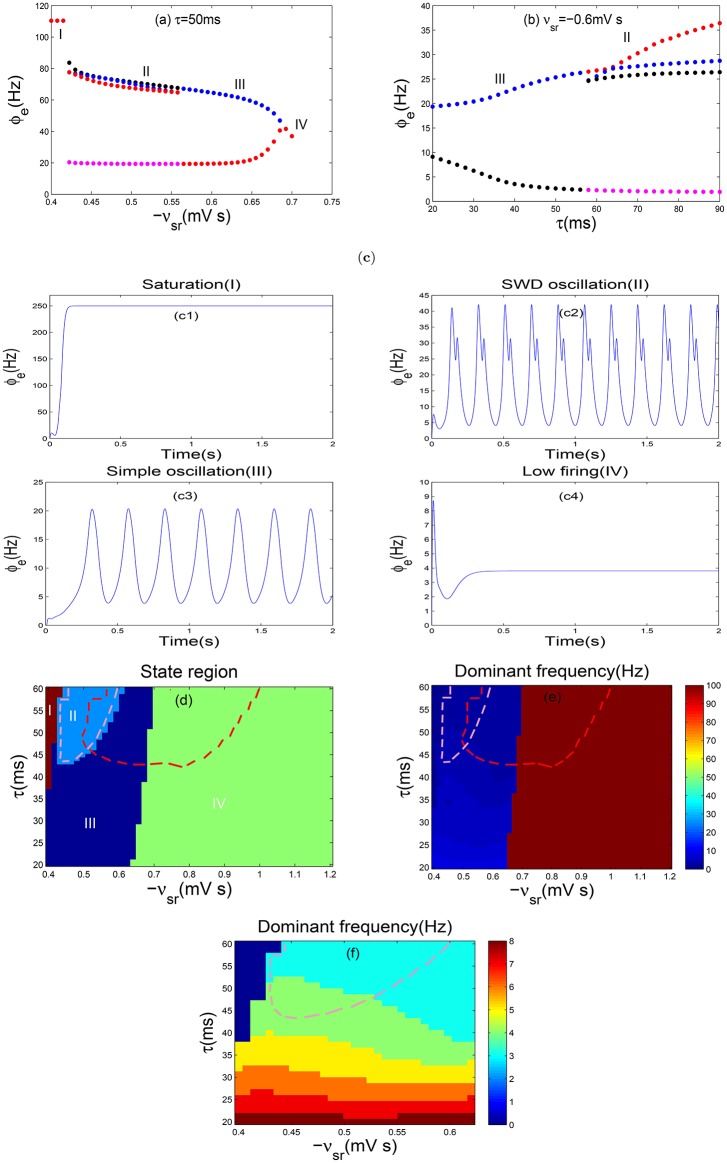
Controlling absence seizures through the DBS to TRN. (a,b) The bifurcation diagrams of ϕe as a function of −vsr (a) and τ (b). In order to observe the bifurcation phenomenon obviously, the ordinate scale is used exactly in a log scale in (a). (c) The typical time series of ϕe are corresponding to the above four different dynamics states. Here we choose −vsr = −0.4 mV s (c1), −vsr = −0.5 mV s (c2), −vsr = −0.6 mV s (c3), −vsr = −0.7 mV s (c4) and set τ = 50 ms. (d–f) Two-dimensional state analysis (d) and the frequency analysis (e) in the (−vsr, τ) panel. The enlargement (f) here is a local focus on (e), with the purpose of observing a obvious phenomenon. Different colors in (d) represent the different dynamical states: the saturation state (I), the SWD oscillation state (II), the simple oscillation region (III), the low firing state (IV). The region surrounded by pink dashed lines in (d,e) represents the SWDs falling into the 2–4 Hz frequency range after adding the DBS to TRN, however the regions surrounded by red dashed lines stand for the 2–4 Hz SWDs without DBS. The SWD oscillation pattern has a obvious reduction, i.e., the absence seizures can be eliminated through the DBS to TRN.

