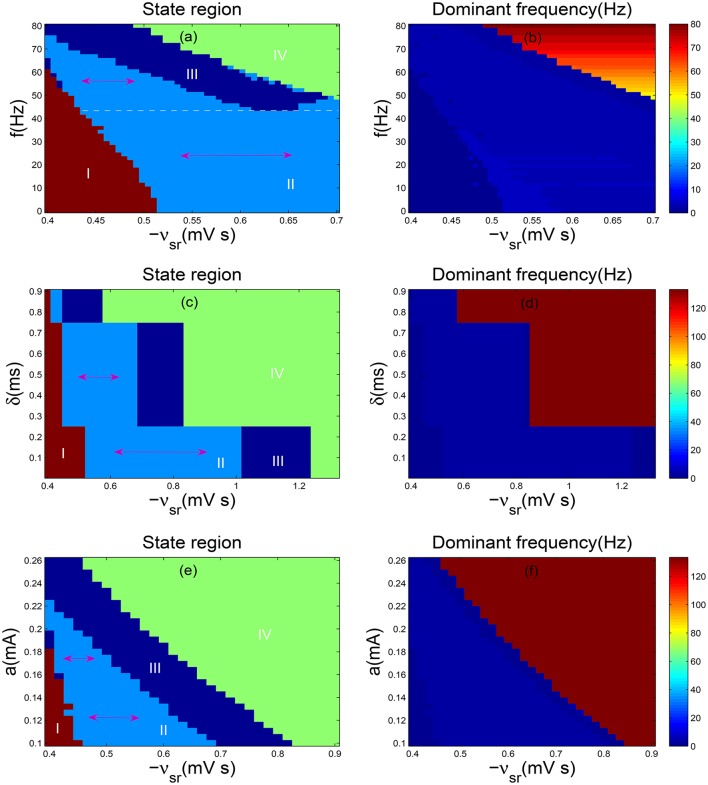
Figure 5.
(a,b) Two-dimensional state analysis (a) and corresponding dominant frequency analysis (b) in the (−vsr, f) panel; (c,d) The state analysis (c) and frequency analysis (d) in the (−vsr, δ) panel; (e,f) The state analysis (e) and frequency analysis (f) in the (−vsr, a) panel. Here we set δ = 2 ms, a = 0.1 mA (a,b); f = 130 Hz, a = 0.1 mA (c,d); f = 130 Hz and δ = 0.7 ms (e,f). −vsr represents the inhibitory coupling strength between TRN and SRN, whereas f denotes frequency, δ is positive input duration and a is stimulation amplitude. Different colors in (a,c,d) represent different dynamics states: the saturation state (I), the SWD oscillation state (II), the simple oscillation state (III), the low firing state (IV). Double sided arrow represents parameter interval of TRN-SRN inhibitory coupling strength −vsr in the SWD oscillation region, and white dashed line stands for the largest one in (a). For all simulations, we set delay τ = 50 ms.

