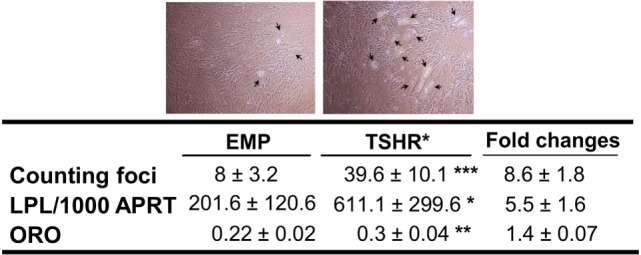
Figure 2.

Adipogenesis in subcutaneous preadipocytes was assessed by foci counting (n = 11, representative photos were shown with arrows indicating differentiating adipocytes), LPL transcripts measured by qPCR (n = 9) and oil red O (ORO, n = 4). Result presented as fold increase in TSHR* populations relative to empty vector controls. The table reports raw data for qPCR results expressed as transcript copy number per 1,000 copies of housekeeper gene APRT (adenosine phosphoribosyl transferase), together with foci numbers and ORO optical density values (mean ± SEM). Histograms = mean ± SEM of all samples studied (each performed in duplicate) (*p < 0.05; **p ≤ 0.01; ***p < 0.005).
