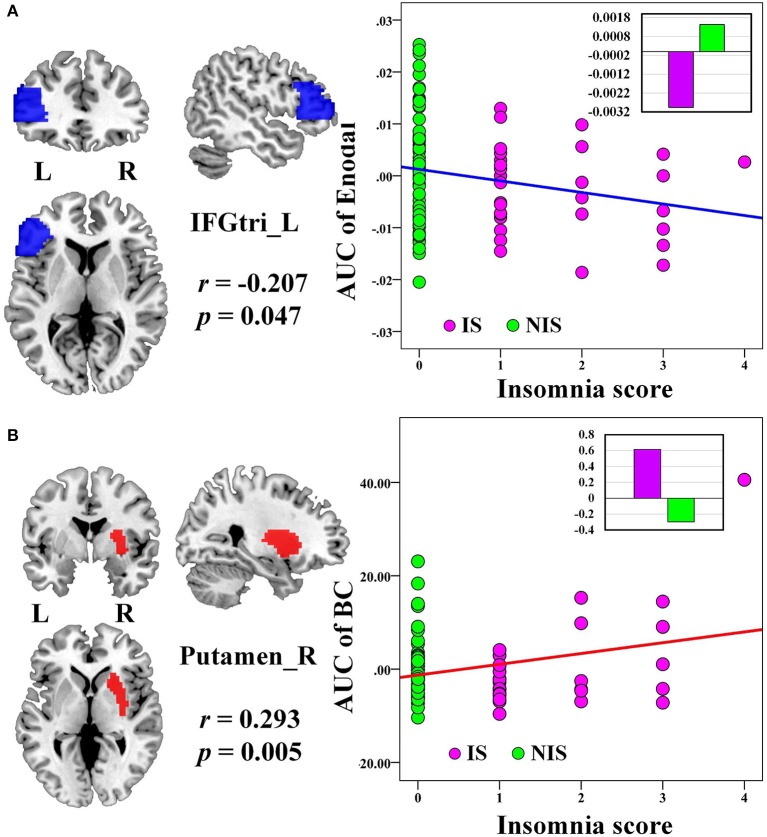
Figure 3.
The Pearson correlation between the AUC of the nodal network properties with insomnia scores in all the subjects (p < 0.05, uncorrected, controlling for the age, gender, educational level, adjusted HAMA score, and adjusted HAMD score). The AUC of each nodal topology was calculated over the range of 0.11 ≤ T ≤ 0.30 with an interval of 0.01. The red color reveals the positive correlation while the blue color represents the negative correlation. The violet circles stand for the IS group while the green circles indicate the NIS group. The bar plots stand for the mean value of each AUC of nodal network properties in corresponding brain regions for IS and NIS groups. The more detailed information were presented in Table 3. L, left; R, right; AUC, area under the curve; BC, nodal betweenness centrality; Enodal, nodal efficiency; IFGtri, inferior frontal gyrus pars triangularis; IS, healthy participants with insomnia symptoms; NIS, healthy participants without insomnia symptoms.

