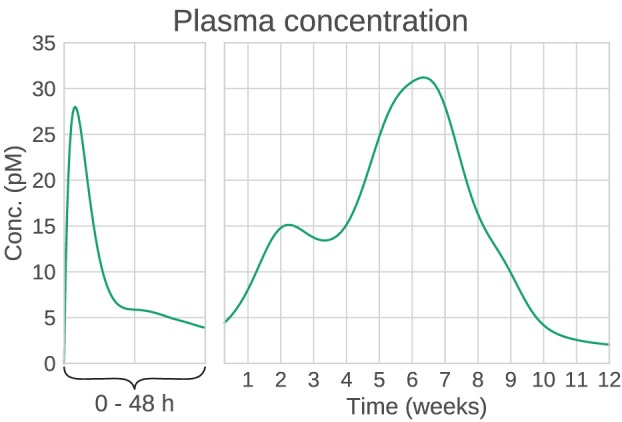
Figure 2.

Example plasma concentration profile of Bydureon, after a single dose of 10 mg. This is a mean prediction from data obtained from the dose finding study by Fineman et al. (2011). Note that the clinical dose is 2 mg, but the characteristics of the PK profile are most clearly seen for the 10 mg dose. The profile shows multiple peaks, making the absorption rate non-trivial to model using conventional compartmental models.
