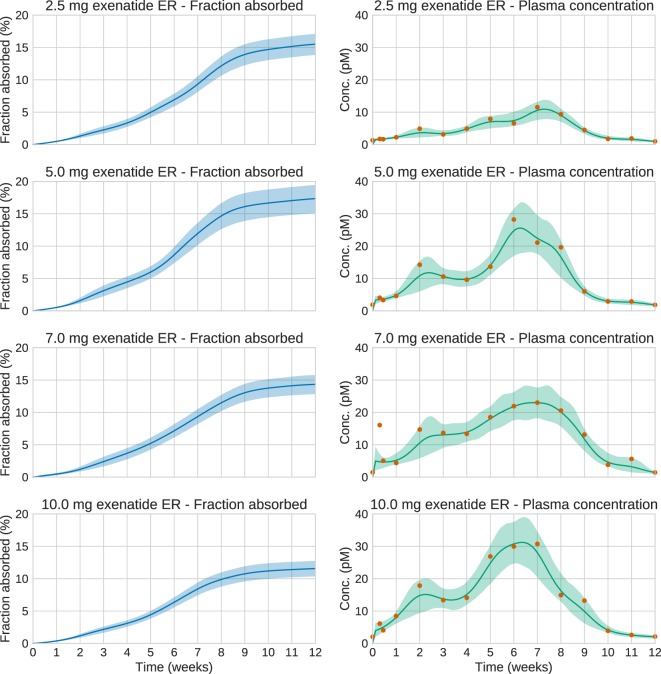
Figure 6.
Estimation results for the whole 12-week period of the real exenatide data. Solid lines are mean predictions, while shaded areas are 95% credible intervals. At these timescales, the system is essentially at steady state. Note that the very large plasma concentration value in the first week for the 7.0 mg dose is treated as an outlier by the estimation method. This is a consequence of using an error model based on the Student’s t-distribution.

