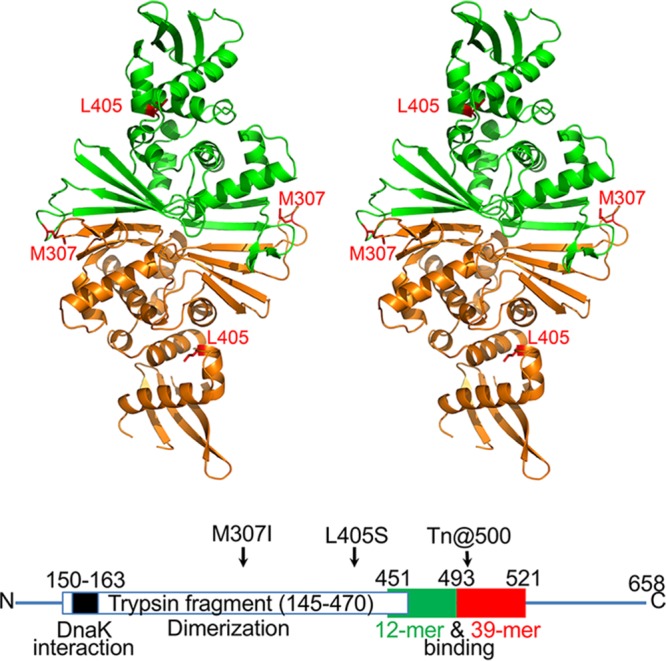
FIG 5 .

Crystal structure of the RctB fragment containing residues 145 to 470. A stereo diagram shows the tracing of the main chain of the RctB dimer, with the two protomers colored green and orange. Elements of the secondary structure are marked (see Fig. S5 in the supplemental material for more details). The side chains of the two residues (M307 and L405) where changes suppressed the initiation defect of the L156R mutant are shown in red in each protomer. The panel was prepared with PyMol (64). Also shown is a linear map of RctB marked with residue numbers of relevance to this study (not drawn to scale). The green and red boxes represent regions considered important for 12-mer and 39-mer binding, respectively (19).
