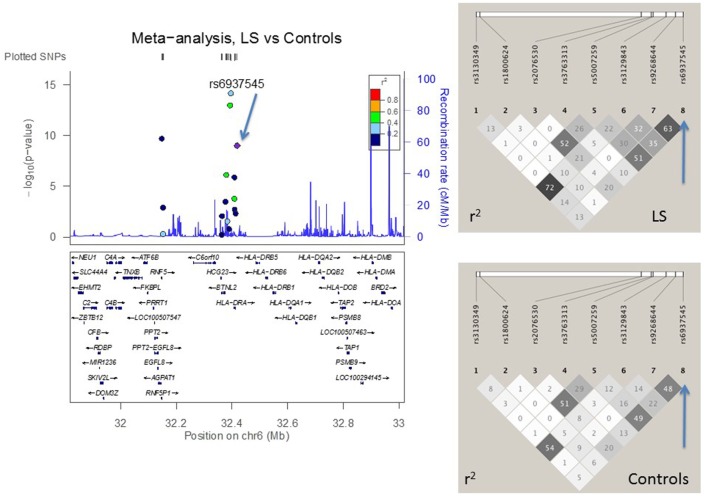
Figure 3.
The meta-analysis of Löfgren (LS) vs. controls with Finnish, Swedish, and Czech samples. The linkage disequilibrium (LD) information (r2) is shown by color-coded dots and the recombination rates where the peaks are the hotspots are based on the HapMap data. The LD structure (r2) in the current study for the top significant SNPs (I2 < 25) are shown on the right. After adjusting for HLA-DRB1 alleles, the SNPs that remained significant are pointed with an arrow.

