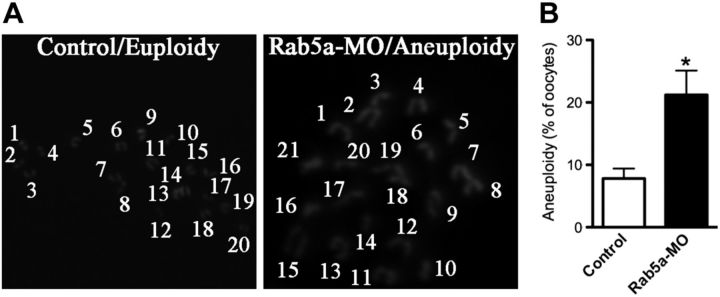
Figure 4.
Increased aneuploidy in oocytes depleted of Rab5a. A) Chromosome spread of control and Rab5a-MO MII oocytes. Representative fluorescence images of euploid and aneuploid oocytes are shown. B) Quantification of aneuploidy in control and Rab5a-MO oocytes. Data are expressed as mean ± sd percentage; 30 oocytes/group were analyzed. *P < 0.05 vs. controls.

