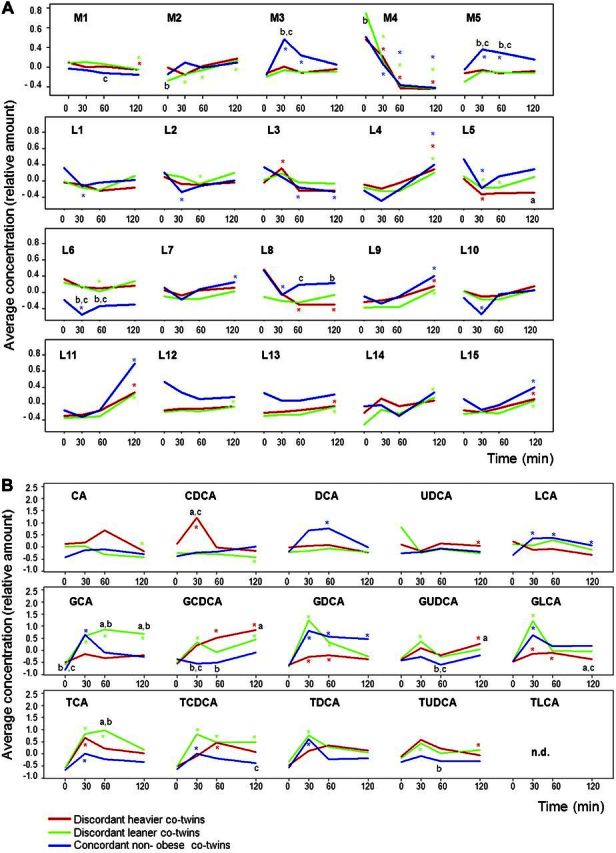
Figure 1.

A) Mean average concentration (in relative amount) of metabolite (M) and lipid (L) clusters for twin groups [DH co-twins (red), DL co-twins (green), and concordant nonobese CL co-twins (blue)] over time (0, 30, 60, 120 min after the BMT). B) Mean average concentration (in relative amount) of unconjugated and conjugated BAs for twin groups over time. For visualization purposes, BA concentrations were scaled to show the mean average concentration of BAs in the same units used for metabolite and lipid clusters in A. G, glycine-conjugated BAs; T, taurine-conjugated BAs. Significant differences between groups for each time point are indicated by letters; asterisks indicate differences between time point and baseline for each group. aP < 0.05 vs. CL; bP < 0.05 vs. DH; cP < 0.05 vs. DL; *P < 0.05 vs. baseline for DH (red), DL (green), CL (blue).
