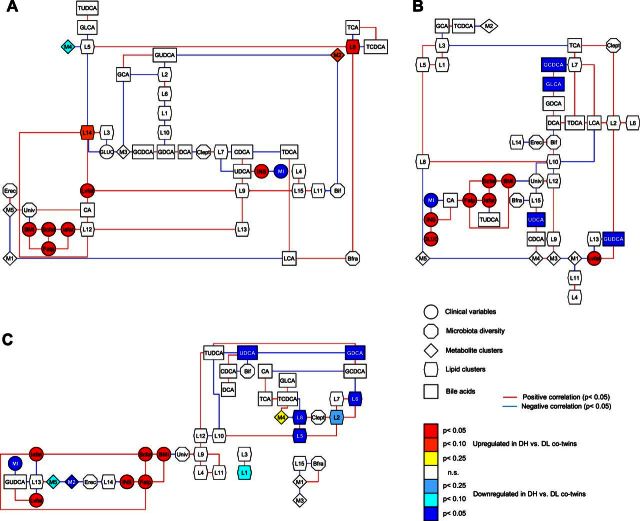
Figure 3.
Dependency network analyses for discordant co-twins for weight. A) Dependency network analysis of baseline concentration levels of metabolite and lipid clusters with BAs; gut microbial diversity; BMI; percentage body fat; intra-abdominal, subcutaneous, and liver fat; glucose and insulin concentrations; and MI. Data were twin normalized by using the within-pair difference between the heavier and the leaner co-twins for clusters, BMI, MI, and microbiota diversity and by using the log2 of the ratio between the heavier and the leaner co-twins for the rest of variables. B) Dependency network analysis using twin-normalized variables and including the end-point concentration levels of metabolite and lipid clusters with BAs; gut microbial diversity; BMI; percentage body fat; intra-abdominal, subcutaneous, and liver fat; glucose and insulin concentrations; and MI. C) Dependency network analysis using twin-normalized variables and including the level differences in metabolic variables (clusters, BAs) between the 120 min end point together with the gut microbial diversity; BMI; percentage body fat; intra-abdominal, subcutaneous, and liver fat; glucose and insulin concentrations; and MI. Node shapes represent different types of variables; node color corresponds to significance and direction of regulation comparing heavier versus leaner co-twins. NS, not significant.

