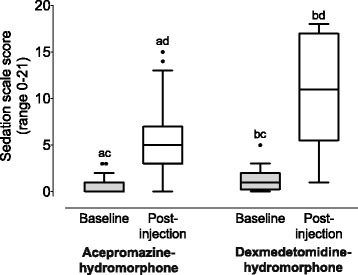
Fig. 2.

Sedation scores recorded before (baseline) and 15 min after injection (post-injection) of the two most common sedation protocols. Acepromazine-hydromorphone, n = 36. Dexmedetomidine-hydromorphone, n = 20. Box and whisker plots show median (central horizontal line), inter-quartile range (box boundaries) and Tukey whiskers. Identical letters indicate statistically significant differences for comparisons within (baseline versus post-injection) and between (baseline scores and post-injection scores) groups. See text for presentation of p values and 95% CI
