
Fig. 2.
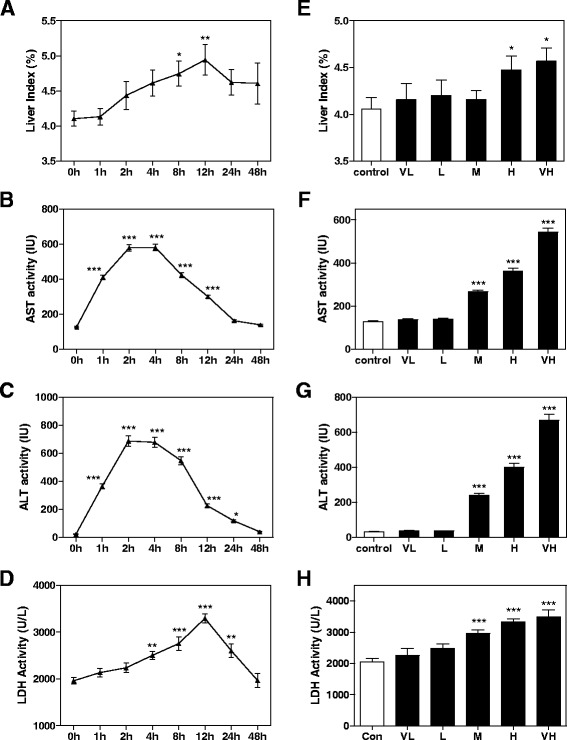
SS-induced liver toxicity. a and e liver index, Serum level of b and f AST, c and g ALT and d and h LDH after different time and dose of SS administration. All the data are presented as mean ± S.E. (n = 8), * p < 0.05, **p < 0.01, ***p < 0.001, compared to time 0 h or vehicle control group, respectively