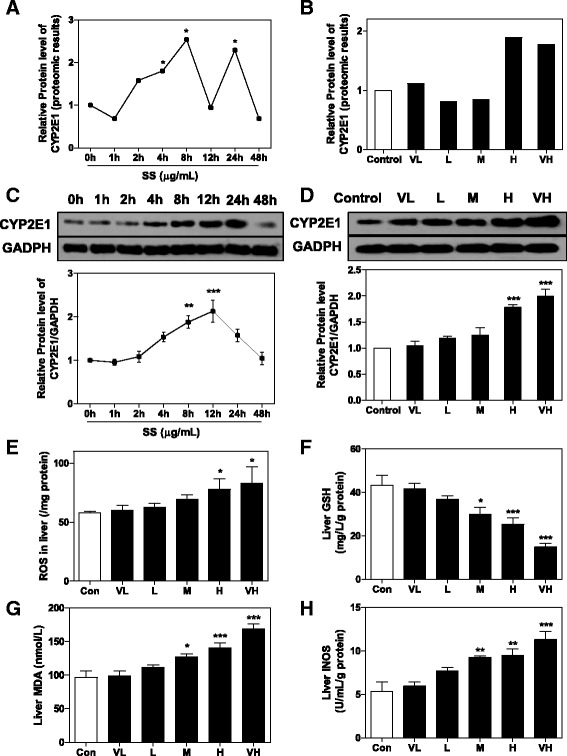
Fig. 7.

SS-induced oxidative stress in mice liver. Proteomic results for CYP2E1 expression in a time-toxicity study and b dose-toxicity study. * p value < 0.05. Proteins levels of CYP2E1 in c time-toxicity study and d dose-toxicity study were determined by western blot. Representative images of immunoblots are shown and analyzed using GAPDH as loading control. Effects of different dose of SS administration on e ROS, f GSH, g MDA and h iNOS level in liver. All results are presented as mean ± S.E. (n = 8),* p < 0.05, **p < 0.01, ***p < 0.001, compared to vehicle control group
