
Fig. 8.
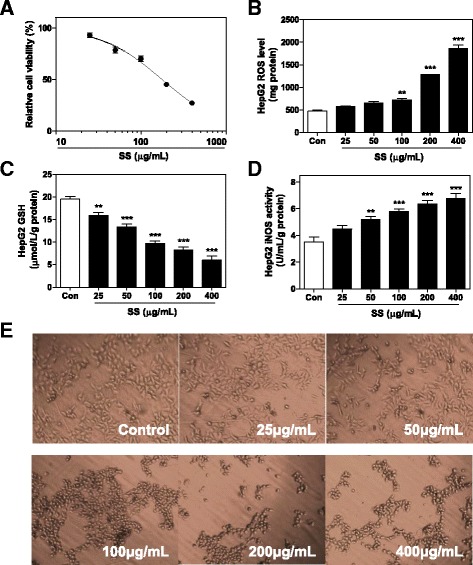
Effects of SS on HepG2 cells. a Effects of SS on cell viability of HepG2 cells after 24 h treatment. Effects of 12 h treatment of SS on b ROS, c GSH and d iNOS level in HepG2 cells. e Effects of SS on morphology changes of HepG2 cells after 12 h treatment. All results are presented as mean ± S.E. (n = 3), **p < 0.01, ***p < 0.001, compared to vehicle control group