Fig. 2.

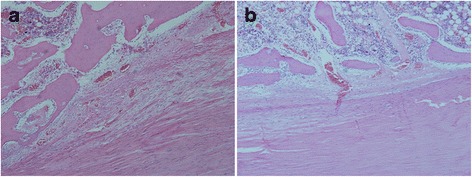
Vascular distribution of the tendon–bone interface, H-E stained ×200. a Blood vessels rich in the tendon–bone interface of negative pressure group. b Blood vessels sparse in the tendon–bone interface of control group

Vascular distribution of the tendon–bone interface, H-E stained ×200. a Blood vessels rich in the tendon–bone interface of negative pressure group. b Blood vessels sparse in the tendon–bone interface of control group