
Fig. 3.
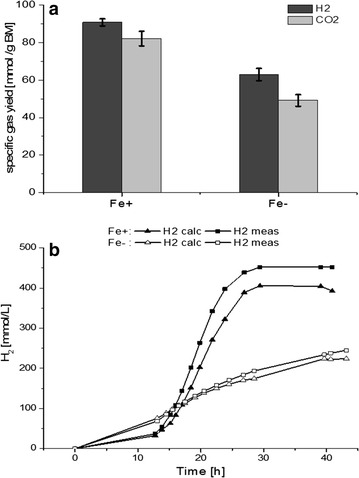
a Measured cumulative hydrogen and carbon dioxide production and b calculated (calc) vs. measured (meas) hydrogen production under iron excess (Fe+) and iron limitation (Fe−) conditions in C. pasteurianum DSMZ 525 cultures
Official websites use .gov
A
.gov website belongs to an official
government organization in the United States.
Secure .gov websites use HTTPS
A lock (
) or https:// means you've safely
connected to the .gov website. Share sensitive
information only on official, secure websites.
a Measured cumulative hydrogen and carbon dioxide production and b calculated (calc) vs. measured (meas) hydrogen production under iron excess (Fe+) and iron limitation (Fe−) conditions in C. pasteurianum DSMZ 525 cultures