
Fig. 1.
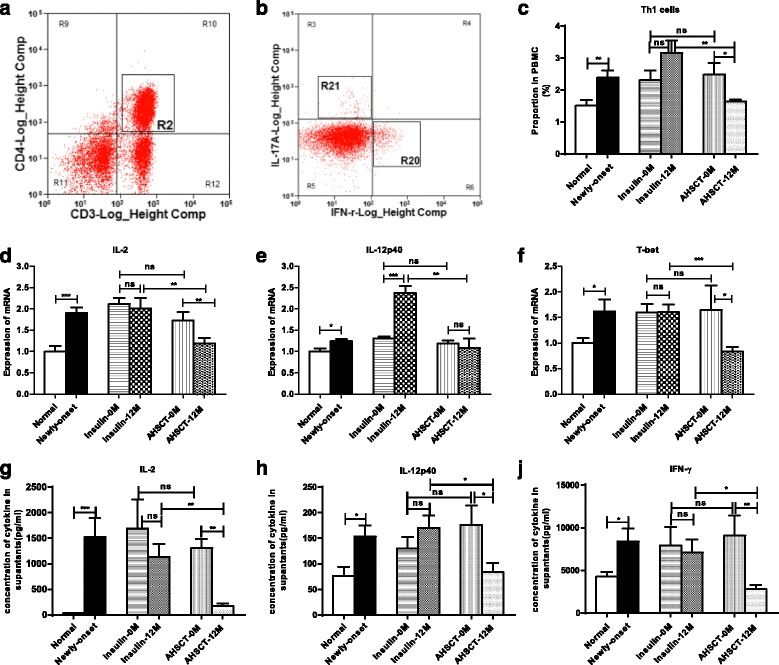
Flow cytometry analysis, cytokine proteins and mRNA measurements of Th1 cells from PBMCs in the AHSCT and Insulin-only groups before and after treatment (0 M and 12 M). a, b Representative flow cytometry plots of CD3+CD4+ (R2) and Th1 cells (R20). c Proportion of IFN-γ+ Th1 cells in PBMCs. d, e, f mRNA expression levels of IL-2, IL-12p40 and T-bet respectively. g, h, j Concentrations of IL-2, IL-12p40 and IFN-γ in the cell culture supernatants respectively. *P < 0.05, **P < 0.01, ***P < 0.001. AHSCT autologous hematopoietic stem cell transplantation, ns no significance, PBMC peripheral blood mononuclear cell