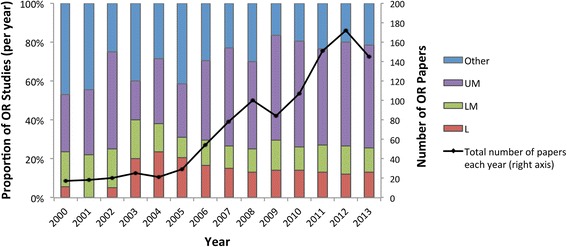
Fig. 4.

Proportion of operations research (OR) studies per year in different country income classifications (bars, left axis); low income (L), lower-middle income (LM), upper-middle income (UM) and Other (includes studies targeted at LMICs in general or some combination of L-, LM- and UM-income countries). Total number of OR papers per year also displayed (line, right axis). Note that 2014 was excluded as this review covers studies indexed up until August 2014 only
