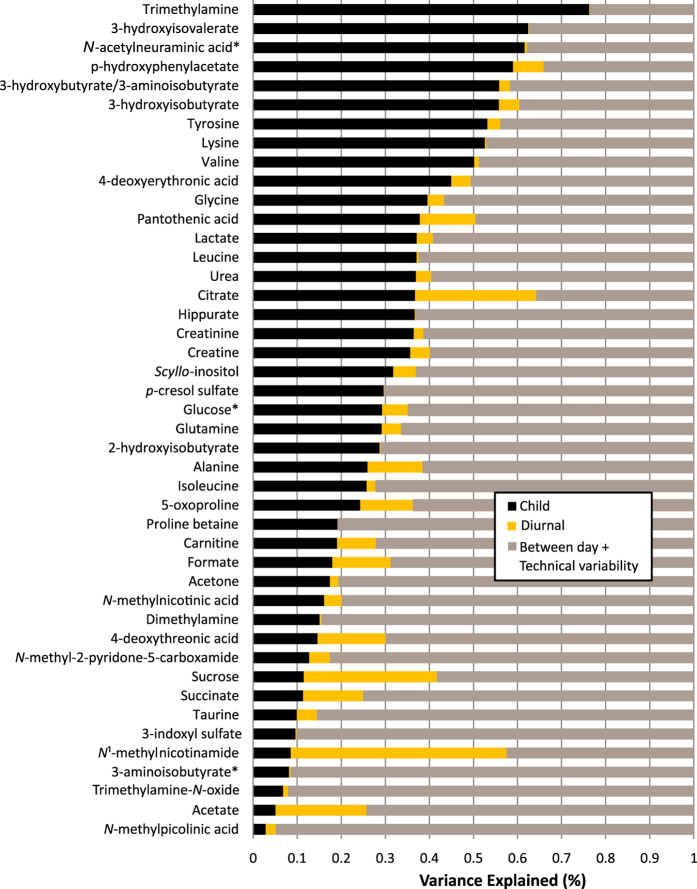
Figure 4. Decomposition of variance for each annotated metabolite resonance in 1H NMR spectra.
The plot displays estimates for the proportion of biological variance explained by child characteristic (black) and diurnal (yellow) components. The remainder of the variance is attributed to day-to-day and technical variability and unknown sources (residual, brown). Metabolites are ordered by estimated child specific variance. *Multiple overlapping resonances. Integral assigned to the most likely, abundant metabolite.

