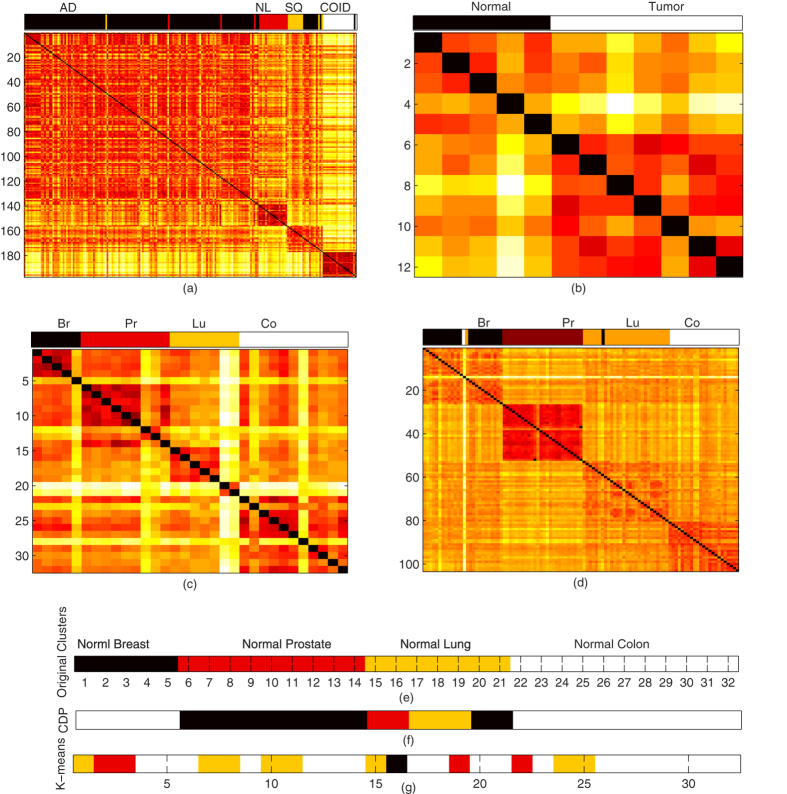
Figure 3. Clustering results for separating normal tissues from tumor, and classification of multi tissue, 1-channel microarray.
(a) Lung cancer data set is organized into four distinct classes, with the accuracy of 98.4772%, normal lung is separated from tumor lung, however, we observe a high similarity between adenocarcinomas and squamous cell carcinomas as visualized in co-occurrence matrix, and color bar at top of co-occurrence matrix demonstrates the discovered classes. (b) The normal and tumor lung of mouse are visualized, with 100% accuracy, we organize the samples into normal and tumor lung. (c) Our approach, with accuracy of 97.1145%, find the four distinct tissue classes in the multi-a gene expression microarray. In multi-b tissue data set, we organize the whole data set into, 9 prostate (pr), 5 breast (br), 11 colon (co), and 7 lung (lu) normal tissues, accurately. (e) With different color schemes, distinct classes of multi-b are visualized, however, in (f,g) clusters of CDP and K-means are visualized at optimal parametric setting, respectively.

