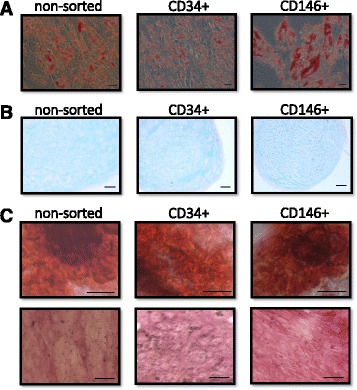
Fig. 6.

Isolated CD146+ and CD34+ cells are multipotent. Micrographs showing differentiation of non-sorted (left), CD34+ (middle), and CD146+ cells (right) into adipocytes (a), chondrocytes (b), and osteocytes (c). a Adipocytes were stained with Oil red O, showing the lipid content in the cells (red). b Histological sections (8 μm) of differentiated chondrocyte pellets were stained with Alcian blue to detect glycosaminoglycans and counterstained with Neutral red. c Alizarin Red S and the alkaline phosphatase activity assay were used to stain osteocytes differentiated for 19 days, resulting in staining of calcium deposits (red, upper row and purple, lower row, respectively). Black scale bars = 50 μm
