Fig. 7.

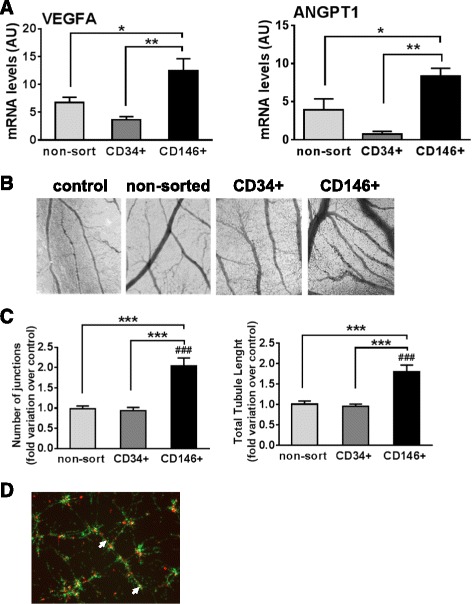
CD146+ cells are angiogenic. a Transcript levels of angiogenic factors VEGFA and ANGPT1 in non-sorted (light gray), CD34+ (dark gray), and CD146+ (black) cells, quantified by qPCR. b CAM micrographs obtained at 40× magnification showing formation of blood vessel plexus at 2 days following incubation with PBS control (left), non-sorted (middle left), CD34+ (middle right), and CD146+ (right) cells. c Quantification of the CAM blood vessel plexus using AngioSys2.1 software as fold variation in blood vessel branching (left) and blood vessel total length (right) over PBS-treated controls. Non-sorted (light gray), CD34+ (dark gray), and CD146+ (black) cells. d Micrographs of in vitro cocultures of equine endothelial (green, labeled with PKH26; 20 μM) and CD146+ (red, labeled with PKH67; 20 μM) cells seeded on matrigel, showing close apposition of CD146+ cells to the endothelial network (white arrows). n ≥ 3 for qPCR, n ≥ 12 for CAM experiments; mean ± SEM. *p < 0.05, **p < 0.001, ***p < 0.0001, differences between different cell types; ###p < 0.0001, difference between CAM incubated with CD146+ cells and with PBS (control). AU arbitrary units
