
Fig. 3.
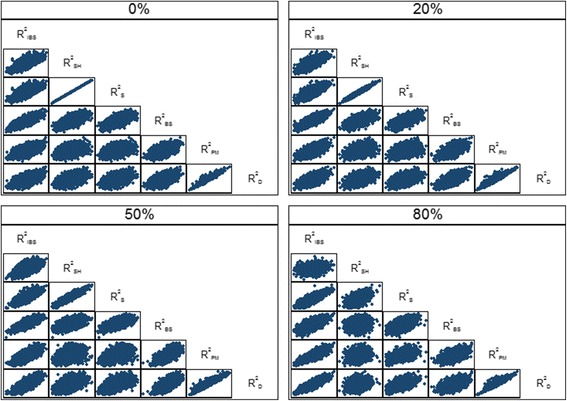
Scatter plot showing the relationships between the overall performance measures for the breast cancer data with the medium risk profile over 5000 simulations
Official websites use .gov
A
.gov website belongs to an official
government organization in the United States.
Secure .gov websites use HTTPS
A lock (
) or https:// means you've safely
connected to the .gov website. Share sensitive
information only on official, secure websites.
Scatter plot showing the relationships between the overall performance measures for the breast cancer data with the medium risk profile over 5000 simulations