Fig. 12.

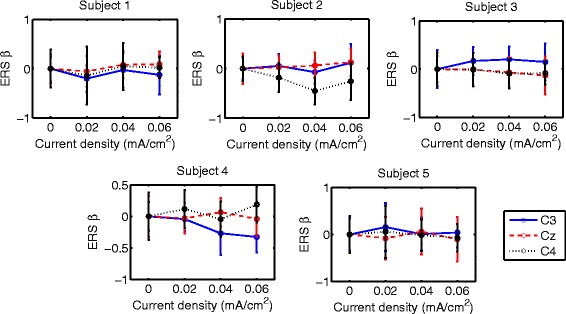
β-ERS during right hand MI with tDCS applied over hand area before EEG recording. Mean ERS is presented (circular markers) for all subjects and current densities in C3, Cz and C4. Error bars represent standard deviation of ERS

β-ERS during right hand MI with tDCS applied over hand area before EEG recording. Mean ERS is presented (circular markers) for all subjects and current densities in C3, Cz and C4. Error bars represent standard deviation of ERS