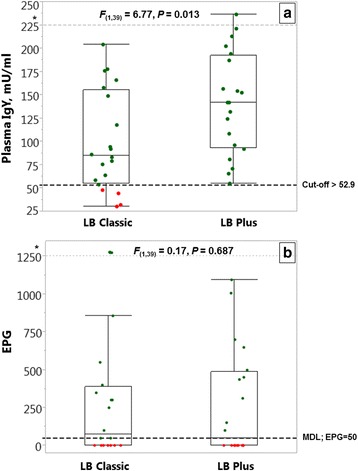
Fig. 5.

Plasma antibody (a) and FECs (b) in naturally infected chickens from the field. Plasma samples (n = 40) were obtained from chickens with naturally occurring nematode infections that were used in a previous study exploring host genetic resistance to nematodes [4]. The dashed line, indicating the cut-off value (52.9 mU/ml), was determined by the ROC analyses for experimentally A. galli infected animals and used here as the threshold to classify the hens as infected or uninfected. Following this separation, the green ( ) and red (
 ) dots represent true and false positive cases, respectively. Outliers above the dashed grey line (* > 300) are shown on an extended reduced scale [reduced y-axis = (y*0.01 + 300)] to depict a focused picture of the whole data. The FECs (faecal egg counts) are expressed as EPG (number of eggs per gram faeces). MDL: minimum detection limit of the McMaster egg counting technique (EPG = 50). For the properties of the box plots, see the explanations given in Fig. 1. The figure represents raw data, but the statistical comparisons are based on the log-transformed data
