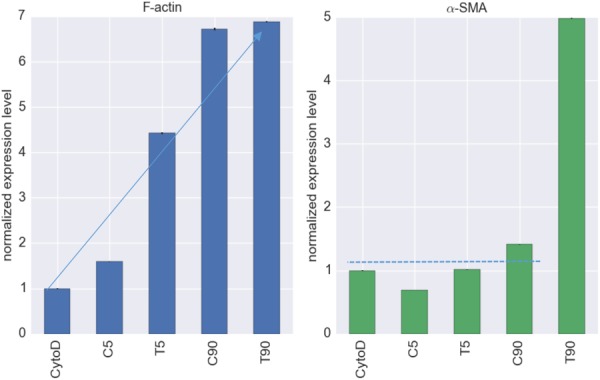
Fig. 4.

Normalized expression levels of F-actin (left) and α-SMA (right). The expression levels were normalized to the CytoD group. TGF-β and/or KCl treatments induced higher levels of F-actin, whereas only the T90 group exhibited an increase in α-SMA, but (∼5 fold).
